

Customer retention rate is the percentage of customers you had at the start of a period who are still buying from you at the end. The formula is ((customers at end − new customers) ÷ customers at start) × 100. The measuring period matters more than anything else: a 95% monthly rate and a 95% annual rate describe very different businesses. Compare your number against your own billing cycle and your own industry, not against a generic "good" figure.
TL;DR:
- Customer retention rate = ((customers at end − new customers acquired) ÷ customers at start) × 100. Leaving out the "minus new customers" step is the most common way owners inflate the number.
- A 95% monthly retention rate compounds to roughly 54% a year, so always state the period before you call a number good or bad.
- An 80% annual rate is solid for retail or hospitality. The same 80% measured monthly would sink a subscription business within a year.
- Moving from 80% to 90% annual retention doubles your average customer's expected lifetime, from five years to ten.
- Customer counts can hide revenue loss. Track revenue retention next to customer retention, and split both by how each customer found you.
Table of Contents
- The Customer Retention Rate Formula, and the One Mistake That Inflates It
- A Worked Customer Retention Rate Example You Can Copy Into a Spreadsheet
- What Customer Retention Means in Business, and Why the Math Favors Keeping People
- Average Customer Retention Rate by Industry, and Why Those Benchmarks Mislead
- Is an 80% Retention Rate Good? It Depends on the Clock You Measure It By
- The 5 Key CX Metrics That Warn You Before Retention Drops
- Where Retention Numbers Lie: Three Cases Where the Obvious Answer Is Wrong
- Find Out Whether Retention Is Really What's Capping Your Growth
- Frequently Asked Questions
- Sources
The Customer Retention Rate Formula, and the One Mistake That Inflates It
The standard customer retention rate formula uses three numbers, all taken from the same period:
- S. Customers at the start. Everyone active on day one of the period.
- E. Customers at the end. Everyone active on the last day.
- N. New customers acquired during the period. Anyone who wasn't a customer on day one.
Customer retention rate = ((E − N) ÷ S) × 100
The step most owners skip is subtracting N. If you start the year with 100 clients and end it with 105, it is tempting to say retention was above 100%. It wasn't. If you signed 25 new clients along the way, only 80 of your original 100 stayed, so retention was 80%. Growth from new sales covered up a fifth of your base walking out the door.
The formula answers one narrow question: of the people who were already customers, how many did you keep? New sales belong in a different metric. Mixing the two lets a business look like it is growing while it loses customers underneath.
A Worked Customer Retention Rate Example You Can Copy Into a Spreadsheet
Take a small bookkeeping firm over one calendar year:
- Clients on January 1 (S): 200
- Clients on December 31 (E): 210
- New clients signed during the year (N): 30
Retention = ((210 − 30) ÷ 200) × 100 = 90%
The firm lost 20 of its original 200 clients and replaced them, plus 10 more, with new business. Ten net new clients sounds healthy, but the 20 lost clients are the number worth looking into.
You don't need a dedicated customer retention rate calculator. Put start, end and new customers in columns B, C and D of a spreadsheet, then enter =(C2-D2)/B2 in column E and format it as a percentage. Add one row per month or quarter and you have a trend line, which tells you far more than any single figure.
Pro Tip: Add a fifth column for how each customer found you: referral, paid ads, discount promotion, or outbound sales. Then calculate retention separately for each channel. Customers who arrived through a steep first-order discount often retain much worse than referrals. If your blended rate is falling, the cause is frequently a change in acquisition mix, and that changes which fix you should pay for.
What Customer Retention Means in Business, and Why the Math Favors Keeping People

In business terms, customer retention is your ability to keep the customers you already paid to acquire, so they go on buying instead of drifting to a competitor or dropping out of the category. It is the reverse of churn. A 90% retention rate means 10% churn over the same period.
The numbers support this. Harvard Business Review's summary of the research notes that acquiring a new customer costs anywhere from five to 25 times more than keeping an existing one. It also cites work by Frederick Reichheld of Bain & Company finding that a 5% increase in retention can raise profits by 25% to 95%.
You can see why with simple lifetime math. If 20% of your customers leave each year (80% retention), the average customer stays about five years, because 1 ÷ 0.20 = 5. At 90% retention, churn is 10%, so the average customer stays about ten years.
Moving from 80% to 90% annual retention doubles the average customer's expected lifetime, from five years to ten.
Put revenue on it. A client worth $1,200 a year at a 60% gross margin generates about $3,600 in lifetime margin at 80% retention and about $7,200 at 90%. That second figure is also the most you could sensibly spend to win each new customer before it stops paying back. Retention also sets your acquisition budget.
Average Customer Retention Rate by Industry, and Why Those Benchmarks Mislead
Most benchmark tables online, including the ones labeled 2022 or later, recycle the same survey data from several years ago. Treat the figures below as rough, directional annual rates, not targets:
| Industry | Commonly cited annual retention | Why it lands there |
|---|---|---|
| Media | ~84% | Subscriptions, habit, auto-renewal |
| Professional services | ~84% | High switching costs, personal relationships |
| Insurance | ~83% | Annual renewals, inertia |
| IT services | ~81% | Contracts and integration lock-in |
| Construction | ~80% | Repeat commercial clients |
| Telecom | ~78% | Contracts, but aggressive competitor offers |
| Banking | ~75% | Sticky accounts, rising fintech competition |
| Retail | ~63% | Low switching cost, price shopping |
| Hospitality and travel | ~55% | Infrequent, occasion-driven purchases |
Retention tracks switching cost and purchase frequency. Where leaving takes paperwork, a migration or an awkward conversation, retention sits in the 80s. Where a customer can switch with one click and buys only now and then, it falls toward the 50s and 60s.
These averages mix large companies with small ones and don't say whether the period is monthly or annual. They also say nothing about one-off purchase businesses, such as a wedding photographer or a roofer, where retention barely applies and referral rate is the number to watch. If your business buys infrequently by nature, a "low" figure against this table may be perfectly healthy.
Is an 80% Retention Rate Good? It Depends on the Clock You Measure It By
An 80% retention rate is good if it is annual and you are in retail, hospitality, or most product businesses. It is ordinary in professional services and insurance. If it is monthly, it is a crisis in almost any business.
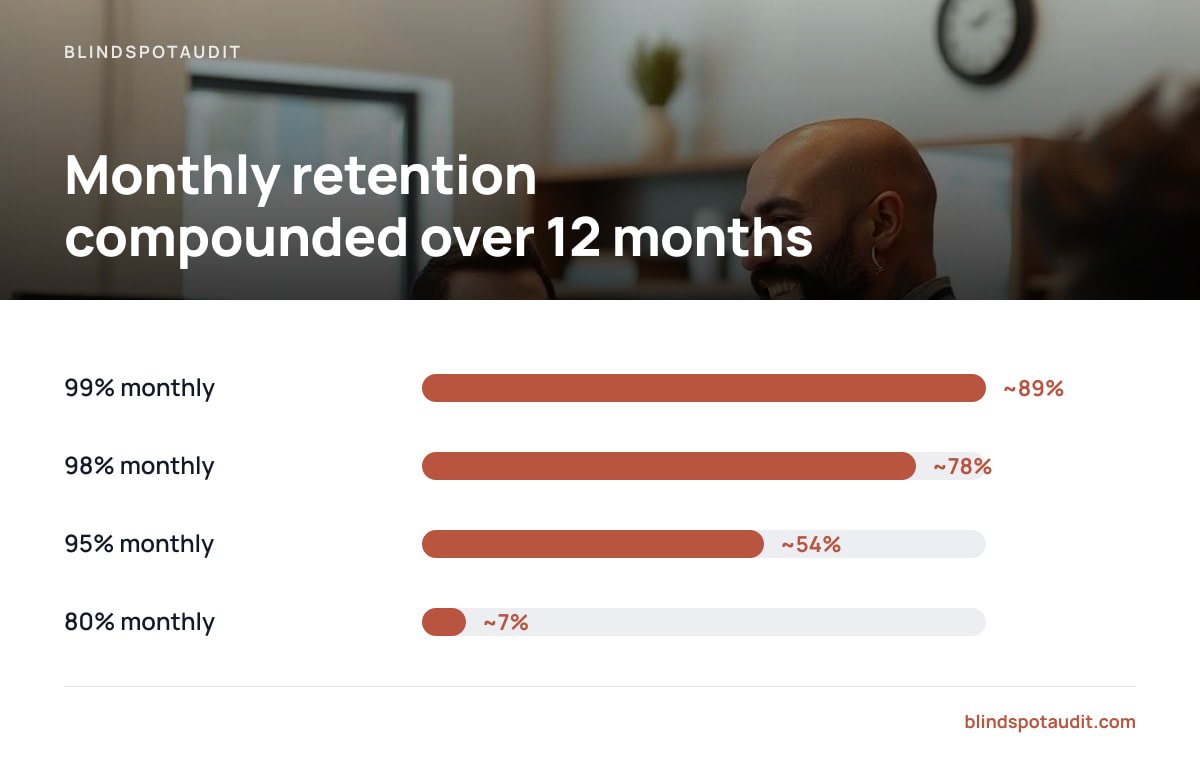
That last point is where most "what is a good customer retention rate" answers fall short, because they never say which period they mean. Retention compounds:
| Monthly retention | Customers left after 12 months |
|---|---|
| 99% | ~89% |
| 98% | ~78% |
| 95% | ~54% |
| 80% | ~7% |
A 95% monthly retention rate sounds excellent. Compounded over 12 months, it means you keep about 54% of your customers.
So before you call any number good, check three things. Is it monthly, quarterly or annual? Does it match how often your customers actually buy? Is it counting customers or revenue? Monthly subscription businesses should care most about the monthly figure. A firm with annual contracts should measure at renewal. An e-commerce store should look at the share of last year's buyers who bought again this year.
The 5 Key CX Metrics That Warn You Before Retention Drops

Retention is a lagging number. By the time it falls, the customers have already gone. These five customer experience metrics are the ones most businesses track, and the first three act as early warnings.
Net Promoter Score (NPS)
Customers answer "How likely are you to recommend us?" on a 0 to 10 scale. NPS is the percentage of promoters (9 or 10) minus the percentage of detractors (0 to 6). Fred Reichheld introduced it in the 2003 Harvard Business Review article "The One Number You Need to Grow", and Bain maintains it through its Net Promoter System. A falling NPS among long-term customers is one of the clearest signs that churn is coming.
Customer Satisfaction Score (CSAT)
CSAT asks customers to rate a specific interaction, often on a 1 to 5 scale. It works well for spotting a bad touchpoint, such as onboarding or support. It is less useful for predicting loyalty, because a customer can be satisfied with one call and still leave.
Customer Effort Score (CES)
CES asks how easy it was to get something done. The 2010 Harvard Business Review study "Stop Trying to Delight Your Customers" argued that reducing customer effort does more for loyalty than going above and beyond. For a small business, this is usually the cheapest lever available: fewer steps to rebook, reorder or get an answer.
Churn Rate
Churn is the share of customers lost in a period, or 100% minus retention. Track it alongside retention because it frames the same data as a loss, and losses get acted on faster.
Customer Lifetime Value (CLV)
CLV is the total margin a customer generates before they leave. As the earlier example showed, it is largely driven by retention. CLV turns a retention percentage into a dollar figure you can use when deciding what to spend on acquisition.
If you can only track one, pick churn: survey scores record how people feel, and churn records what they did.
Where Retention Numbers Lie: Three Cases Where the Obvious Answer Is Wrong
Logo retention hides revenue loss. Losing your largest client and keeping nine small ones shows as 90% customer retention. Your revenue may have dropped by half. If your top five customers make up more than a third of revenue, track net revenue retention as well: revenue from last year's customers this year, divided by their revenue last year. Read the two figures together.
Small bases create false alarms. With 20 clients, one departure moves your rate by five points. Don't rebuild your service over one bad quarter. Use a rolling 12-month figure until you have at least 100 customers.
Some churn is healthy. If you raised prices or stopped serving a bad-fit segment on purpose, retention will dip, and that may be exactly the right outcome. Measure retention among the customers you actually want to keep. A 95% rate built on underpricing is not a success.
When retention is weak, the cause often sits upstream. The wrong customers came in through vague positioning, or sales promised something delivery couldn't provide. Our guide to finding what's capping your business growth explains how to trace a symptom like churn back to its real source before you spend money fixing the wrong thing.
Find Out Whether Retention Is Really What's Capping Your Growth

Weak retention is easy to misdiagnose. You can pour money into loyalty perks when the real problem is that your marketing attracts customers who were never a good fit. Blindspotaudit runs a ten-minute Client Base audit for $67. It scores how well you keep, grow and learn from your existing customers, then gives you the one fix worth doing first, in plain English and with no sales call. If you suspect the leak starts earlier, the complete analysis covers positioning, marketing, sales and client base for $197, with an optional $120 video review. The free Blind Spot Checklist is a place to start.
One honest limit: it is a self-assessment. It won't pull your churn figures from your billing system, so do the spreadsheet calculation above first and answer from real numbers rather than gut feel. If you want broader context first, see our guide to diagnosing what's capping growth.
Frequently Asked Questions
What is the formula for customer retention rate?
Customer retention rate equals ((customers at end of period − new customers acquired during the period) ÷ customers at start of period) × 100. Subtracting new customers is essential, because otherwise sales growth hides customers you lost. All three numbers must come from the same period.
Is an 80% retention rate good?
An 80% annual retention rate is good for retail, hospitality and most product businesses, and about average for professional services or insurance. Measured monthly, 80% would leave you with roughly 7% of your customers after a year. Always confirm the period before judging the number.
What is the average customer retention rate by industry?
Commonly cited annual figures run from roughly 84% in media and professional services down to about 63% in retail and 55% in hospitality and travel. Industries with high switching costs and frequent purchases retain best. Treat these as directional, because most published benchmarks reuse older survey data and rarely state the measuring period.
What are the 5 key CX metrics?
The five most widely tracked customer experience metrics are Net Promoter Score, Customer Satisfaction Score, Customer Effort Score, churn rate and customer lifetime value. The first three are early warnings drawn from surveys. Churn and lifetime value measure what customers actually did.
Is YouTube audience retention the same as customer retention rate?
No. YouTube audience retention measures how much of a video viewers watch before clicking away, and it is reported inside YouTube Studio. Customer retention rate measures how many paying customers keep buying over time. The only thing they share is the word "retention," so benchmarks for one tell you nothing about the other.
How often should a small business measure retention?
Match the period to how often your customers buy: monthly for subscriptions, at renewal for annual contracts, and yearly for most product businesses. If you have fewer than about 100 customers, use a rolling 12-month figure so one departure doesn't swing the result. Watch the trend over several periods rather than any single number.
Sources
- The Value of Keeping the Right Customers | Harvard Business Review
- The One Number You Need to Grow | Harvard Business Review
- Stop Trying to Delight Your Customers | Harvard Business Review
- Net Promoter System | Bain & Company
Leave a Reply